


Display Data In Pie Chart Using PHP And jQuery
Last Updated : Jul 1, 2023
IN - PHP jQuery Google API | Written & Updated By - Pragati
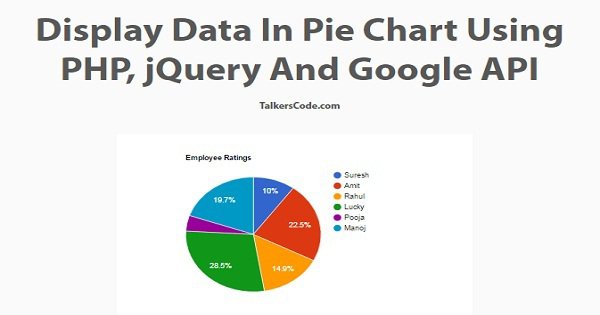
In this tutorial we will show you how to display data in pie chart using PHP, jQuery and Google API, a pie chart (or a circle chart) is a circular statistical graphic, which is divided into slices to illustrate numerical proportion.It is generally used in business world when you have to display comparison or difference of some data in a graphical manner.
CHECK OUT THIS TUTORIAL LIVE DEMO →
To Display Data In Pie Chart It Takes Only One Step:-
- Make a PHP file to display data in pie chart
Step 1. Make a PHP file to display data in pie chart
We make a PHP file and save it with a name display_piechart.php
<?php

 $rating_data = array(
 array('Employee', 'Rating'),
 array('Suresh',25),
 array('Amit',56),
 array('Rahul',37),
 array('Lucky',71),
 array('Pooja',11),
 array('Manoj',49)
);

 $encoded_data = json_encode($rating_data);
?>

<html>
<head>
<script type="text/javascript" src="https://www.google.com/jsapi"></script>
<script type="text/javascript" src="http://ajax.googleapis.com/ajax/libs/jquery/1.8.2/jquery.min.js"></script>
<script type="text/javascript">
google.load("visualization", "1", {packages:["corechart"]});
google.setOnLoadCallback(drawChart);
function drawChart()
{
 var data = google.visualization.arrayToDataTable(
 <?php  echo $encoded_data; ?>
 );
 var options = {
  title: "Employee Ratings"
 };
 var chart = new google.visualization.PieChart(document.getElementById("employee_piechart"));
 chart.draw(data, options);
}
</script>
<style>
body
{
 margin:0 auto;
 padding:0px;
 text-align:center;
 width:100%;
 font-family: "Myriad Pro","Helvetica Neue",Helvetica,Arial,Sans-Serif;
 background-color:#FAFAFA;
}
#wrapper
{
 margin:0 auto;
 padding:0px;
 text-align:center;
 width:995px;
}
#wrapper h1
{
 margin-top:50px;
 font-size:45px;
 color:#585858;
}
#wrapper h1 p
{
 font-size:18px;
}
#employee_piechart
{
 padding:0px;
 width:600px;
 height:400px;
 margin-left:190px;
}
</style>
</head>
<body>
 <div id="employee_piechart" style="width: 900px; height: 500px;"></div>
</body>
</html>
In this step create a 'rating_data' array and add some sample employee name and ratings to display in pie chart then we encode the array using json_encode() function.
Now we add Google API and jQuery which helps to display pie chart we use google predefined function to load packages and then create a function drawChart() which gets our encoded array and then create an object of google pie chart to draw pie chart in 'employee_piechart' div.
That's all, this is how to display data in pie chart using PHP and jQuery. You can customize this code further as per your requirement. And please feel free to give comments on this tutorial.
I hope this tutorial on pie chart jquery and php helps you and the steps and method mentioned above are easy to follow and implement.
 About Pragati
Experienced coding content writer who enjoys breaking down complex concepts in programming languages like Java, Python, C, and C++. Over three years of experience producing interesting and relevant content for a variety of entities. Committed to providing concise and easy-to-understand articles that assist readers in easily understanding technology and industry trends in the world of coding and software development.
RELATED TUTORIALS
 Display Data In Pie Chart Using PHP And jQuery
 Extract URL Data Like Facebook Using PHP,jQuery And Ajax
 Load Data From Database Without Page Refresh Using Ajax and jQuery
 Display Progress Bar While Page Loads Using jQuery
 Export MySQL Data To Excel Using PHP And HTML
 Display Text Over Image Using HTML And CSS
 Display Latest Twitter Status Using PHP
 Display Preloading Image On Image Loading Using jQuery
 Display Loading Image While Page Loads
 Validate The Form Data Before And After Submitting The Form Using JavaScript And PHP